
Forecast Scoreboard · Markets · Portland–Auburn
Who forecasts Portland–Auburn weather best?
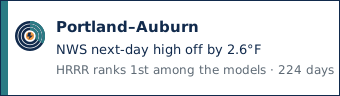
HRRR ranks first among the models when tomorrow's high, low, and rain chance are scored together. Among the models, NAM had the smallest miss on next-day highs, off by 2.2°F.
The National Weather Service and the weather models are scored at Portland, Portland International Jetport (KPWM), against the climate day for that airport. The airport is the official observation site for the market’s primary city. It is not every climate in the television market. Television stations are not graded.
Storms covering this airport
Common questions
- How accurate is the weather forecast in Portland–Auburn?
- The National Weather Service next-day high in Portland–Auburn has been off by 2.6°F on average over 224 days. Among the models, NAM has the smallest miss on next-day highs, off by 2.2°F on average over 216 days.
- Which weather model is most accurate for Portland–Auburn?
- HRRR led the next-day board. That board ranks tomorrow's high, low, and rain chance together against the National Weather Service. Among the models, NAM had the smallest miss on highs, off by 2.2°F on average across 216 days scored.
- How far off is the 7-day forecast in Portland–Auburn?
- Not enough data yet.
- How many days of forecasts are scored in Portland–Auburn?
- The National Weather Service next-day high at Portland, Portland International Jetport (KPWM) is scored over 224 days. GFS's next-day record covers 224 days.
Over the last 224 days in Portland–Auburn, the National Weather Service day-1 high was off by 2.6°F on average. HRRR led the next-day board. That board ranks tomorrow's high, low, and rain chance together against the National Weather Service. Among the models, NAM had the smallest miss on highs, off by 2.2°F on average across 216 days scored.
How to read this. A shorter miss is closer to the weather that happened. Beats the NWS means a smaller miss than the National Weather Service on the same days. Behind the NWS means a larger miss. Early read means at least 90 days scored. Proven means 180.
The technical details
Skill is 1 minus this forecast’s mean loss divided by the National Weather Service mean loss on the same days. Loss is the mean absolute error for temperature and the Brier score for rain chance. Zero is a tie. Positive beats the Weather Service. Negative falls behind it.
Days scored are matched days: issue dates with a forecast from this source and from the National Weather Service, and a final observation. A rank starts at 90 matched days. That status is provisional, shown here as Early read. At 180 matched days the status is established, shown here as Proven. Below the first line the row is still collecting and is not a rank.
How sure is a 95% confidence interval: a percentile bootstrap of the score, resampling the matched days 2,000 times. Overlapping intervals are marked tied.
The headline score uses days 1 through 5, with lead weights 0.30, 0.25, 0.20, 0.15, and 0.10. Days 6 and 7 stay out of it. Variable weights are high 0.35, low 0.30, and rain chance 0.35. Observations come from ACIS, with the National Weather Service climate report when ACIS has a hole. Model numbers come from each provider’s public files.
The methodology page is the full reference. How we grade says the same rules in plain English.
Weather models · NWS Gray forecast accuracy (NWS GYX)
Models at KPWM
Same airport, same climate day, compared with the National Weather Service. This table ranks models. It is not a station grade.
Includes archived forecasts back to March 31, 2026.
Next day
Tomorrow only, compared with the National Weather Service. Every model that has a next-day forecast can appear. A rank starts at 90 days scored.
- 4 ECMWF IFS Behind the NWS by 23% 3.9° high error
- 3 GFS Behind the NWS by 11% 2.9° high error
- 1 HRRR Beats the NWS by 3% 3.0° high error
| Place on this list. 1 was closest to the weather that happened. A tie shares this number, and the next place skips ahead. Early read until the longer day count, then proven. | The weather model. Models are scored on their own against the National Weather Service. | SkillBeats the National Weather Service when the miss is smaller on the same days. 0 is the same, positive is better, negative is worse. The technical name is skill: 1 minus this forecast's loss divided by the Weather Service loss. | High errorAverage miss on daily highs, in degrees F. Lower is better. | Matched daysDays scored. How many climate days this number is averaged over. The technical name is matched days. | StatusEarly read means at least 90 days scored. Proven means 180 or more. Still collecting means it is too soon to rank. The technical names are provisional and established. |
|---|---|---|---|---|---|
| 4 | ECMWF IFS | Behind the NWS by 23% | 223 | Proven | |
| 3 | GFS | Behind the NWS by 11% | 224 | Proven | |
| 1 | HRRR | Beats the NWS by 3% | 223 | Proven | |
| 2 | NAM | Behind the NWS by 2% | 216 | Proven | |
| 5 | ECMWF AIFS | Behind the NWS by 71% | 223 | Proven | |
| — | Canadian GEM (GDPS) | Beats the NWS by 13% | 43 | Fewer than 90 days scored. | |
| — | GEML | — | — | 0 | No scored days yet. |
| — | ICON | Beats the NWS by 40% | 43 | Fewer than 90 days scored. |
Full week
The whole week. NAM and HRRR do not cover that range, so they are listed as not eligible and are not given a full-week comparison.
| Place on this list. 1 was closest to the weather that happened. A tie shares this number, and the next place skips ahead. Early read until the longer day count, then proven. | The weather model. Models are scored on their own against the National Weather Service. | SkillBeats the National Weather Service when the miss is smaller on the same days. 0 is the same, positive is better, negative is worse. The technical name is skill: 1 minus this forecast's loss divided by the Weather Service loss. | High errorAverage miss on daily highs, in degrees F. Lower is better. | Matched daysDays scored. How many climate days this number is averaged over. The technical name is matched days. | StatusEarly read means at least 90 days scored. Proven means 180 or more. Still collecting means it is too soon to rank. The technical names are provisional and established. |
|---|---|---|---|---|---|
| — | ECMWF IFS | Behind the NWS by 21% | 36 | Fewer than 90 days scored. | |
| — | GFS | Behind the NWS by 18% | 38 | Fewer than 90 days scored. | |
| — | HRRR | — | — | — | Not eligible |
| — | NAM | — | — | — | Not eligible |
| — | ECMWF AIFS | Behind the NWS by 58% | 37 | Fewer than 90 days scored. | |
| — | Canadian GEM (GDPS) | Behind the NWS by 9% | 37 | Fewer than 90 days scored. | |
| — | GEML | — | — | 0 | No scored days yet. |
| — | ICON | Beats the NWS by 5% | 29 | Fewer than 90 days scored. |
The bar is the mean high-temperature error. A shorter bar is closer to the observed high. Skill above zero beats the National Weather Service on the same days.
Other markets
Same state
Nearby
Stations
Listed so you can see who broadcasts in this market. Not a rank, and not a grade.
Embed this badge
Next-day highs at Portland, Portland International Jetport (KPWM). The day count is the scored days on file. A rank starts at 90 days.
NWS baseline at Portland, Portland International Jetport
This is the reference, not a contestant. Error here is the government point forecast against the climate day, on every day both exist. The airport is in the NWS Gray office (NWS GYX).
Latest forecast archived Nov 11, 2026, 11:23 PM ET.
| LeadHow far ahead. Day 1 is the next calendar day. Days 6 and 7 are shown and are not in the headline score. The technical name is lead. | Matched daysDays scored. How many climate days this number is averaged over. The technical name is matched days. | High MAEAverage miss on daily highs, in degrees F. Mean absolute error. Lower is better. | High biasAverage of the signed misses on daily highs, in degrees F. Positive means the forecast was too warm. The technical name is high bias. | Low MAEAverage miss on daily lows, in degrees F. Lower is better. The low is the climate-day minimum, which is not always the overnight low. | Low biasAverage of the signed misses on daily lows, in degrees F. Positive means the forecast was too warm. The technical name is low bias. | Brier scoreRain probability score. Average of (forecast probability minus what happened) squared. Lower is better. The technical name is the Brier score. |
|---|---|---|---|---|---|---|
| Day 1 | 224 | 2.6° | -0.5° | 4.1° | 0.8° | 0.145 |
| Day 2 | 223 | 3.0° | -0.6° | 4.2° | 0.8° | 0.169 |
| Day 3 | 222 | 3.2° | -0.4° | 4.0° | 0.9° | 0.162 |
| Day 4 | 221 | 3.7° | 1.1° | 4.0° | 1.0° | 0.175 |
| Day 5 | 220 | 4.5° | 1.4° | 4.1° | 1.0° | 0.197 |
| Day 6 extended | 219 | 4.8° | 1.3° | 6.0° | 0.8° | 0.221 |
| Day 7 extended | 38 | 4.3° | -0.9° | — | — | 0.212 |
Bias is forecast minus observed. Positive means the forecast was too warm. Days 6 and 7 are not part of the headline score.
Official observations
Climate day at KPWM: midnight to midnight, local standard time. The low on this table is that day’s minimum, which is not always the overnight low a television graphic means. Why that choice is explicit.
| The climate day, midnight to midnight local standard time. | Daily high in degrees F. A forecast cell is the predicted high. An observation cell is the official climate-day maximum. | Daily low in degrees F. A forecast cell is the predicted low. An observation cell is the climate-day minimum, which is not always the overnight low. | PrecipitationClimate-day rain in inches. A trace is shown as Trace and is not a rain day. The technical name is precipitation. | EventWhether the day had measurable rain. A trace is not a rain day. The technical name is precipitation event. | SourceWhere the observation came from. ACIS is primary. The National Weather Service climate report fills a hole. |
|---|---|---|---|---|---|
| Nov 10, 2026 | 53.0° | 35.0° | 0.00 in | No | acis |
| Nov 9, 2026 | 58.0° | 40.0° | 0.04 in | Yes | acis |
| Nov 8, 2026 | 51.0° | 39.0° | 0.14 in | Yes | acis |
| Nov 7, 2026 | 57.0° | 45.0° | 0.21 in | Yes | acis |
| Nov 6, 2026 | 63.0° | 55.0° | 0.71 in | Yes | acis |
| Nov 5, 2026 | 66.0° | 54.0° | 0.03 in | Yes | acis |
| Nov 4, 2026 | 73.0° | 46.0° | 0.00 in | No | acis |
| Nov 3, 2026 | 63.0° | 52.0° | Trace | No | acis |
| Nov 2, 2026 | 72.0° | 35.0° | 0.00 in | No | acis |
| Nov 1, 2026 | 54.0° | 25.0° | 0.00 in | No | acis |